


Photo Credit: Studio Romantic / Shutterstock
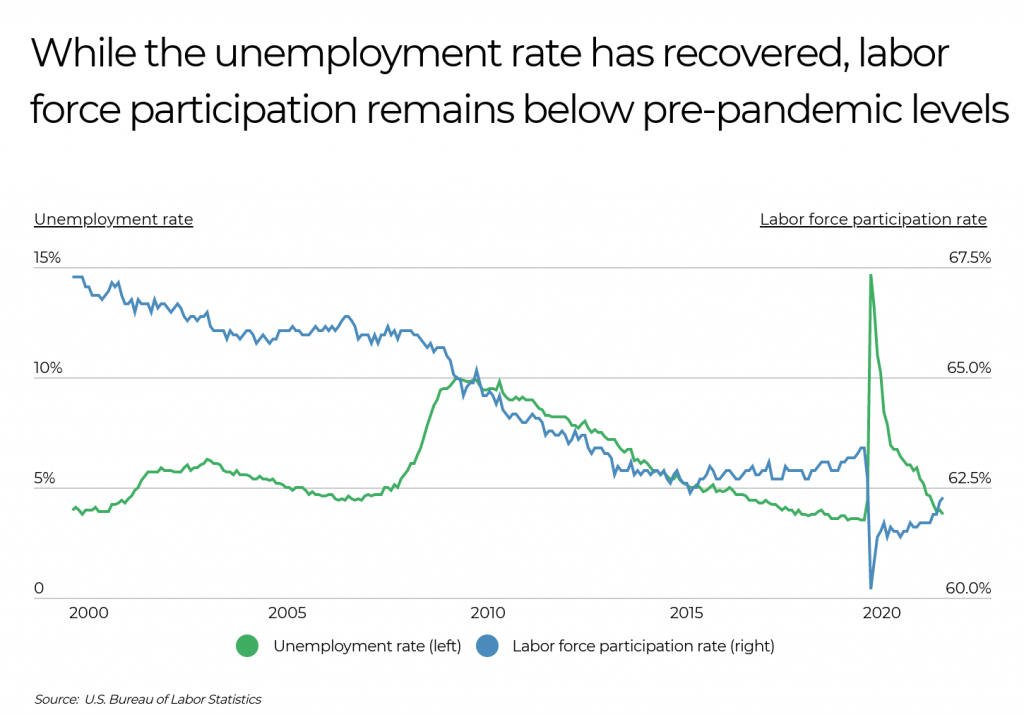
The U.S. job market has made great strides in its recovery since the early days of the COVID-19 pandemic. In April 2020, the unemployment rate skyrocketed to 14.7%, the highest it’s been since the Great Depression. But since spring of 2020, the unemployment rate has fallen steadily and currently stands below 4%, just slightly higher than the pre-pandemic rate of 3.5%. While all sectors of the economy were impacted by the pandemic and shutdown in early 2020, some parts of the economy have bounced back more quickly than others.
For example, while the unemployment rate could reach pre-pandemic levels by this summer, the labor force participation rate continues to lag behind. In February 2020, the labor force participation rate was 63.4%. After dropping sharply in the early stages of the pandemic and then partially recovering, it is still nearly a full percentage point below the pre-pandemic level.
There are several reasons for reduced labor force participation. Many older workers decided to retire early during the pandemic and are unlikely to return. Nearly 1 million Americans, many of which were part of the workforce, have died from COVID, and millions more are suffering from long COVID and unable to work. Additionally, school and daycare closures have forced many parents to leave their jobs due to caregiving responsibilities.
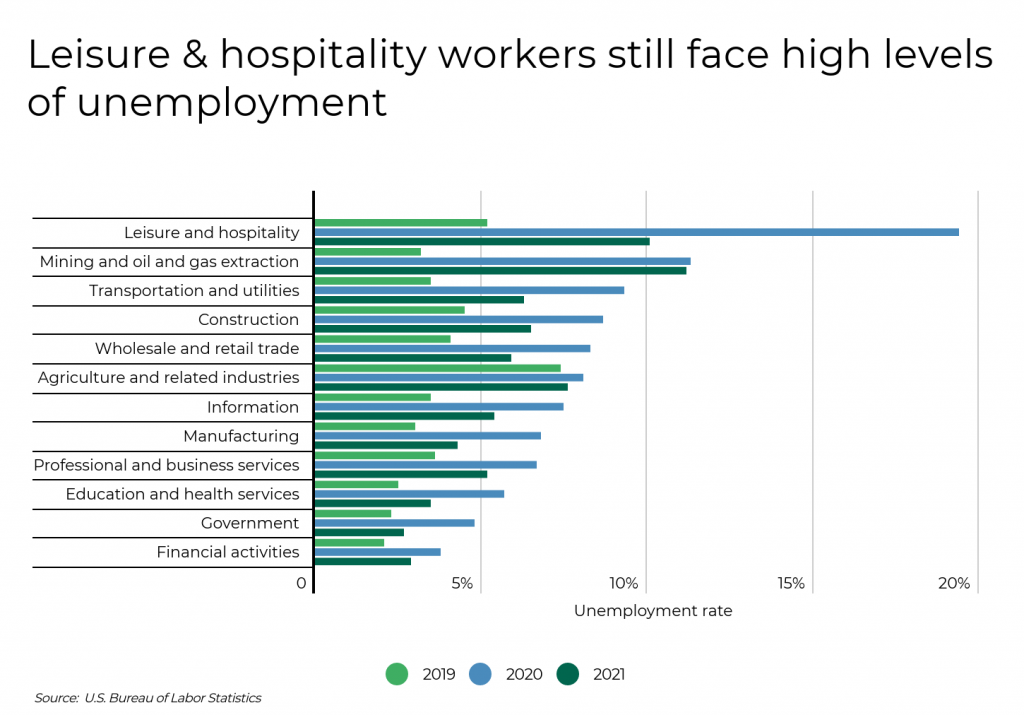
Besides reduced labor force participation, other aspects of the job market still have progress to be made. Some industries, particularly ones that are highly reliant on face-to-face interactions, remained hindered in 2021. The leisure and hospitality sector was the hardest hit of all; its annual unemployment rate jumped to 19.4% in 2020 from 5.2% in 2019. By 2021 its annual unemployment rate had dropped to 10.1%, still nearly double its pre-pandemic rate. Unemployment in mining, quarrying, and oil and gas extraction has also been slow to recover, but that is likely to change amid the Russian oil ban. The sector’s average unemployment rate was over 11% in 2020 and 2021.
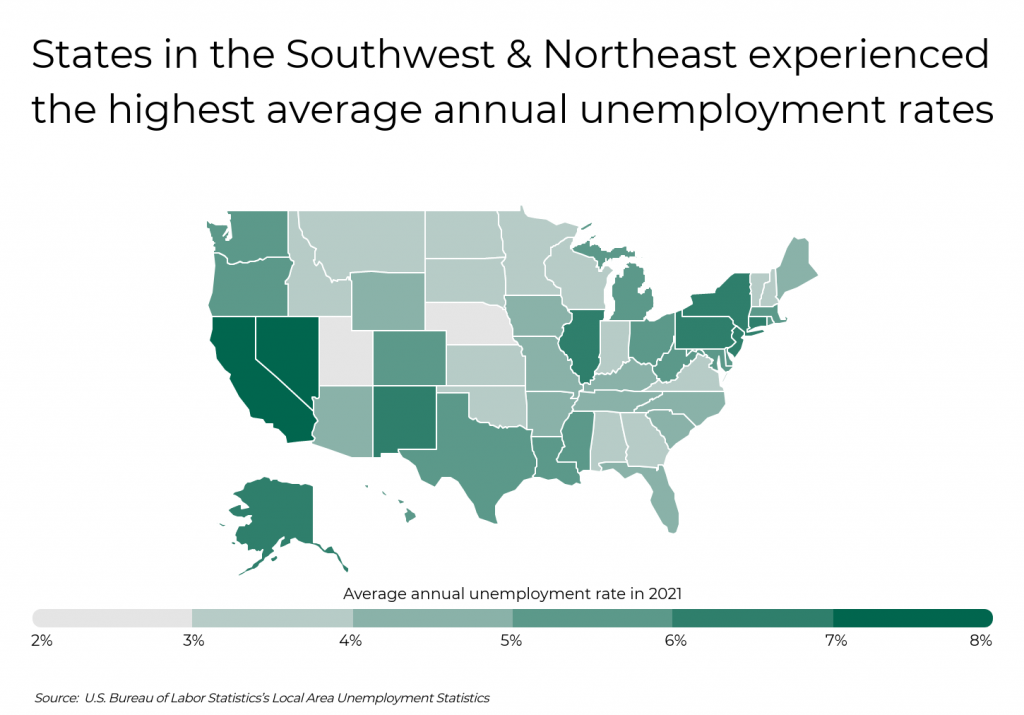
On a geographic level, states that rely heavily on tourism, leisure, and hospitality were more likely to have elevated unemployment rates in 2021. Additionally, states with more restrictive COVID policies also tended to have more impacted workforces. California, Nevada, and New York had the highest unemployment rates in 2021, at 7.3%, 7.2%, and 6.9% respectively. At the other end of the spectrum, states in the Midwest, Mountain West, and South reported the lowest levels of unemployment. For example, in 2021, Utah and Nebraska had unemployment rates of just 2.7% and 2.5%.
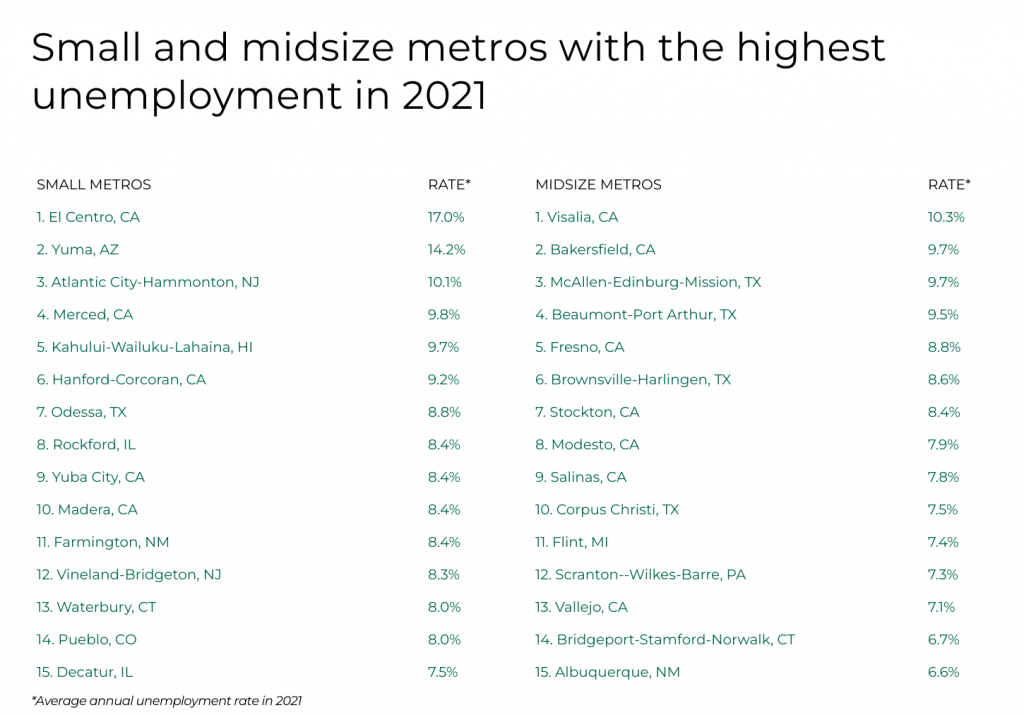
To determine the U.S. metropolitan areas with the highest overall unemployment rate in 2021, researchers at Filterbuy analyzed data from the U.S. Bureau of Labor Statistics. The researchers ranked metros according to the average annual unemployment rate in 2021. Researchers also calculated the average number of unemployed workers in 2021, the change in unemployment rate since 2020, and the change in unemployment rate since 2019. To improve relevance, only metropolitan areas with at least 100,000 people were included in the analysis.
Here are the metros with the highest unemployment rates in 2021.
Large Metros With the Highest Unemployment in 2021
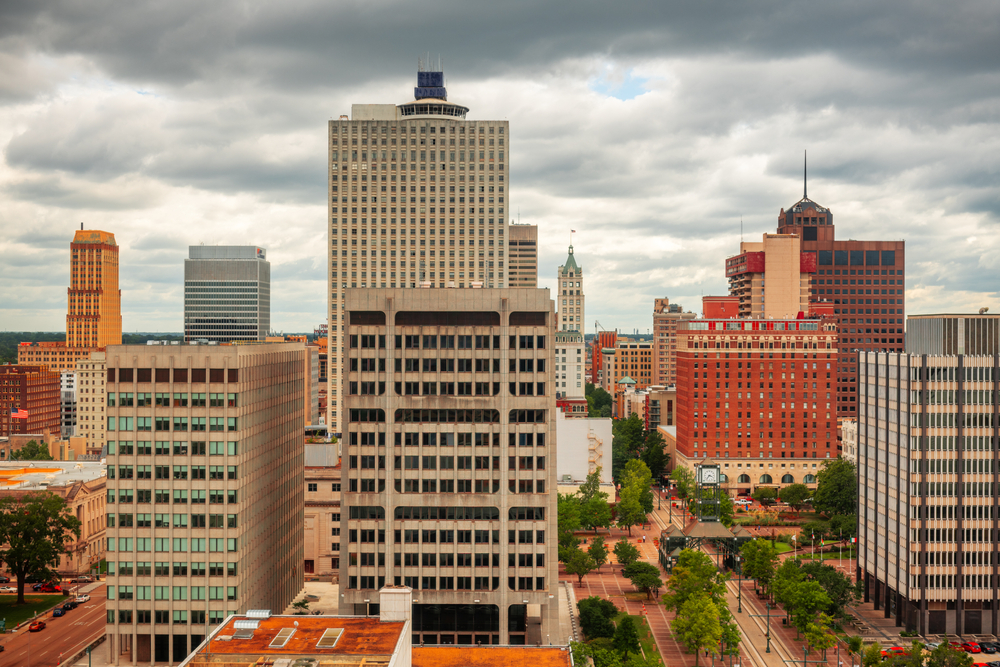
Photo Credit: Sean Pavone / Shutterstock
15. Memphis, TN-MS-AR
- Average annual unemployment rate in 2021: 5.9%
- Average number of unemployed workers in 2021: 37,975
- Change in unemployment rate since 2020 (percentage points): -2.9
- Change in unemployment rate since 2019 (percentage points): +1.7
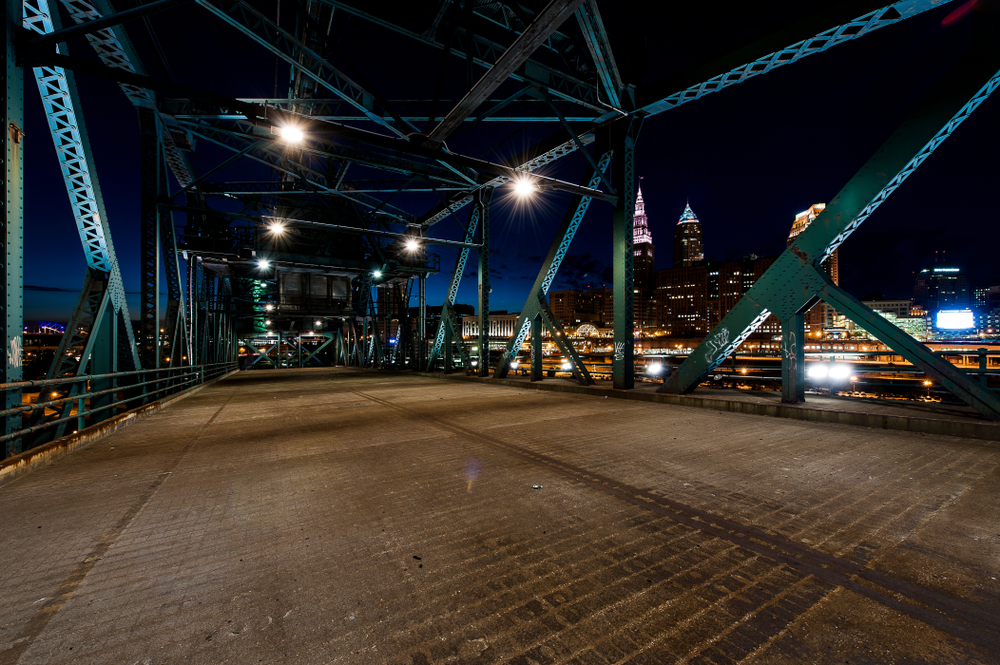
Photo Credit: The American Wanderer / Shutterstock
14. Cleveland-Elyria, OH
- Average annual unemployment rate in 2021: 5.9%
- Average number of unemployed workers in 2021: 59,744
- Change in unemployment rate since 2020 (percentage points): -3.9
- Change in unemployment rate since 2019 (percentage points): +1.7
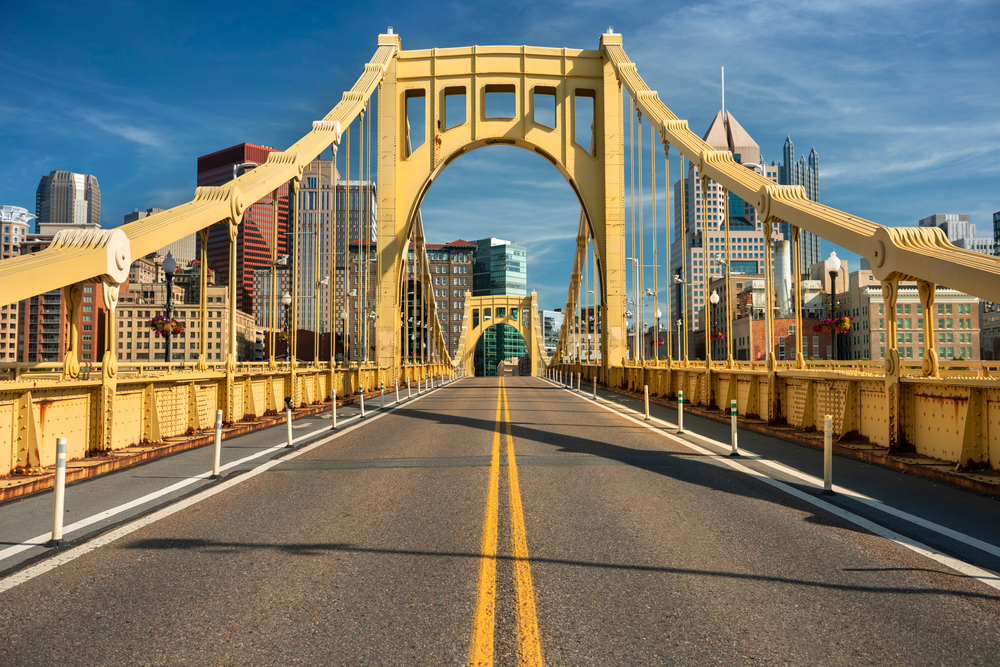
Photo Credit: AevanStock / Shutterstock
13. Pittsburgh, PA
- Average annual unemployment rate in 2021: 6.1%
- Average number of unemployed workers in 2021: 71,379
- Change in unemployment rate since 2020 (percentage points): -3.1
- Change in unemployment rate since 2019 (percentage points): +1.7
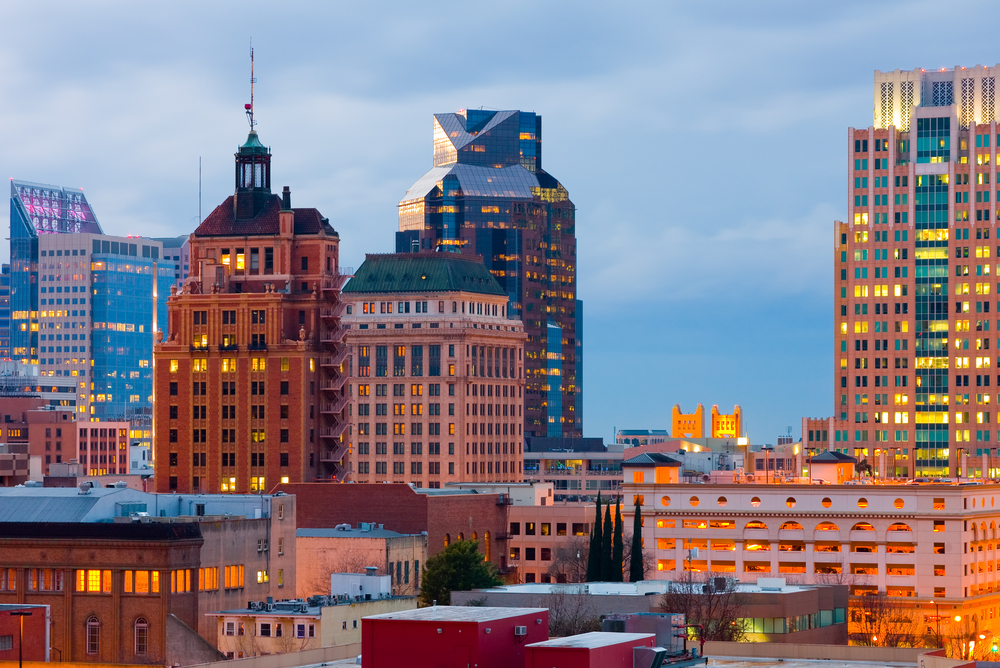
Photo Credit: Andrew Zarivny / Shutterstock
12. Sacramento-Roseville-Folsom, CA
- Average annual unemployment rate in 2021: 6.2%
- Average number of unemployed workers in 2021: 67,659
- Change in unemployment rate since 2020 (percentage points): -2.5
- Change in unemployment rate since 2019 (percentage points): +2.5

Photo Credit: Concrete Jungle Media / Shutterstock
11. Detroit-Warren-Dearborn, MI
- Average annual unemployment rate in 2021: 6.2%
- Average number of unemployed workers in 2021: 131,597
- Change in unemployment rate since 2020 (percentage points): -5.3
- Change in unemployment rate since 2019 (percentage points): +2.0

Photo Credit: Lucky-photographer / Shutterstock
10. San Diego-Chula Vista-Carlsbad, CA
- Average annual unemployment rate in 2021: 6.3%
- Average number of unemployed workers in 2021: 96,330
- Change in unemployment rate since 2020 (percentage points): -2.9
- Change in unemployment rate since 2019 (percentage points): +3.0

Photo Credit: Sean Pavone / Shutterstock
9. Philadelphia-Camden-Wilmington, PA-NJ-DE-MD
- Average annual unemployment rate in 2021: 6.3%
- Average number of unemployed workers in 2021: 192,279
- Change in unemployment rate since 2020 (percentage points): -2.9
- Change in unemployment rate since 2019 (percentage points): +2.2
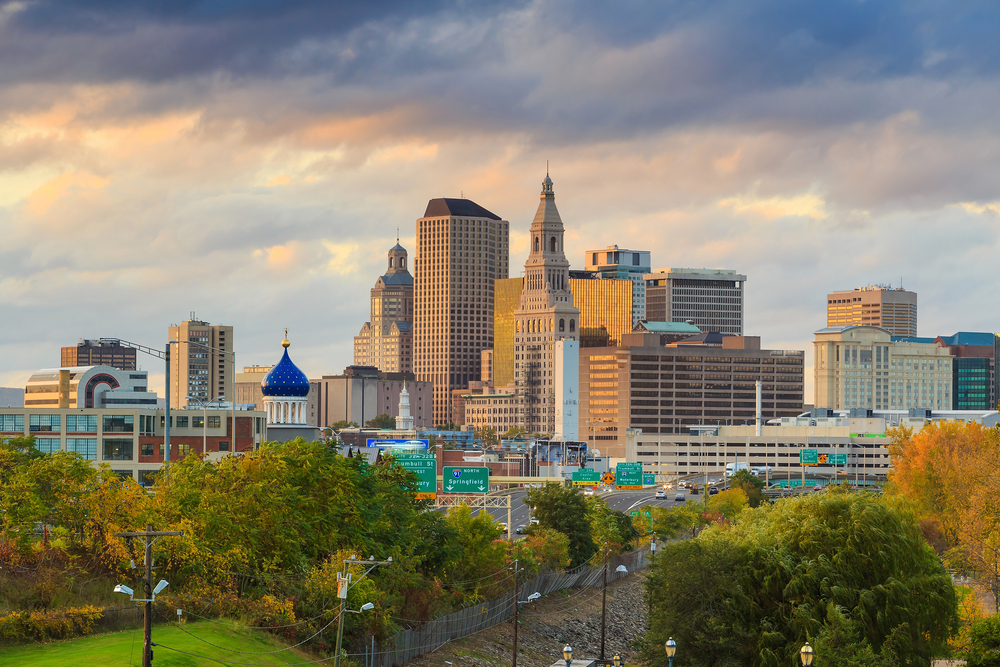
Photo Credit: f11photo / Shutterstock
8. Hartford-East Hartford-Middletown, CT
- Average annual unemployment rate in 2021: 6.6%
- Average number of unemployed workers in 2021: 38,793
- Change in unemployment rate since 2020 (percentage points): -1.1
- Change in unemployment rate since 2019 (percentage points): +3.0
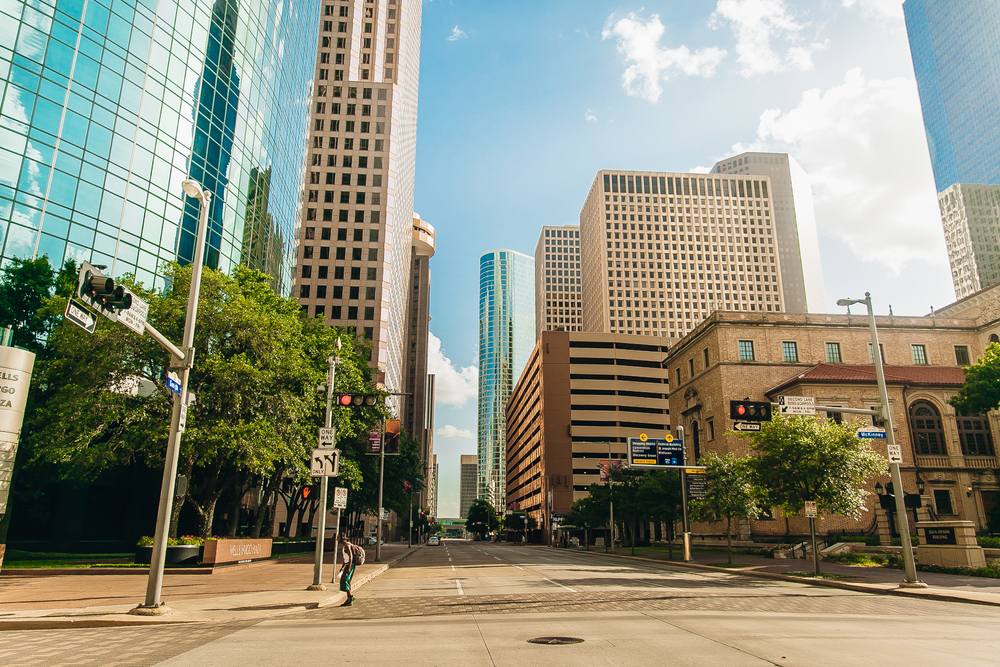
Photo Credit: Tomas Simkus / Shutterstock
7. Houston-The Woodlands-Sugar Land, TX
- Average annual unemployment rate in 2021: 6.6%
- Average number of unemployed workers in 2021: 226,911
- Change in unemployment rate since 2020 (percentage points): -2.0
- Change in unemployment rate since 2019 (percentage points): +2.8

Photo Credit: Jonathan Siegel / Shutterstock
6. Chicago-Naperville-Elgin, IL-IN-WI
- Average annual unemployment rate in 2021: 6.8%
- Average number of unemployed workers in 2021: 320,395
- Change in unemployment rate since 2020 (percentage points): -3.1
- Change in unemployment rate since 2019 (percentage points): +2.9

Photo Credit: evenfh / Shutterstock
5. New Orleans-Metairie, LA
- Average annual unemployment rate in 2021: 7.1%
- Average number of unemployed workers in 2021: 41,476
- Change in unemployment rate since 2020 (percentage points): -2.6
- Change in unemployment rate since 2019 (percentage points): +2.8
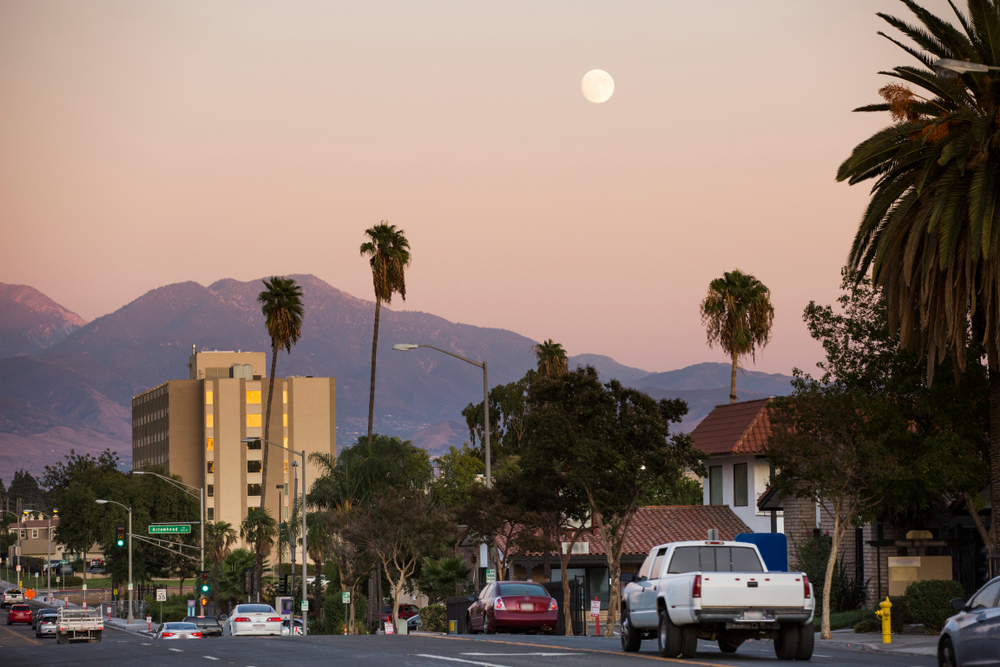
Photo Credit: Matt Gush / Shutterstock
4. Riverside-San Bernardino-Ontario, CA
- Average annual unemployment rate in 2021: 7.2%
- Average number of unemployed workers in 2021: 150,179
- Change in unemployment rate since 2020 (percentage points): -2.5
- Change in unemployment rate since 2019 (percentage points): +3.1

Photo Credit: William Perugini / Shutterstock
3. New York-Newark-Jersey City, NY-NJ-PA
- Average annual unemployment rate in 2021: 7.7%
- Average number of unemployed workers in 2021: 745,984
- Change in unemployment rate since 2020 (percentage points): -2.7
- Change in unemployment rate since 2019 (percentage points): +4.1
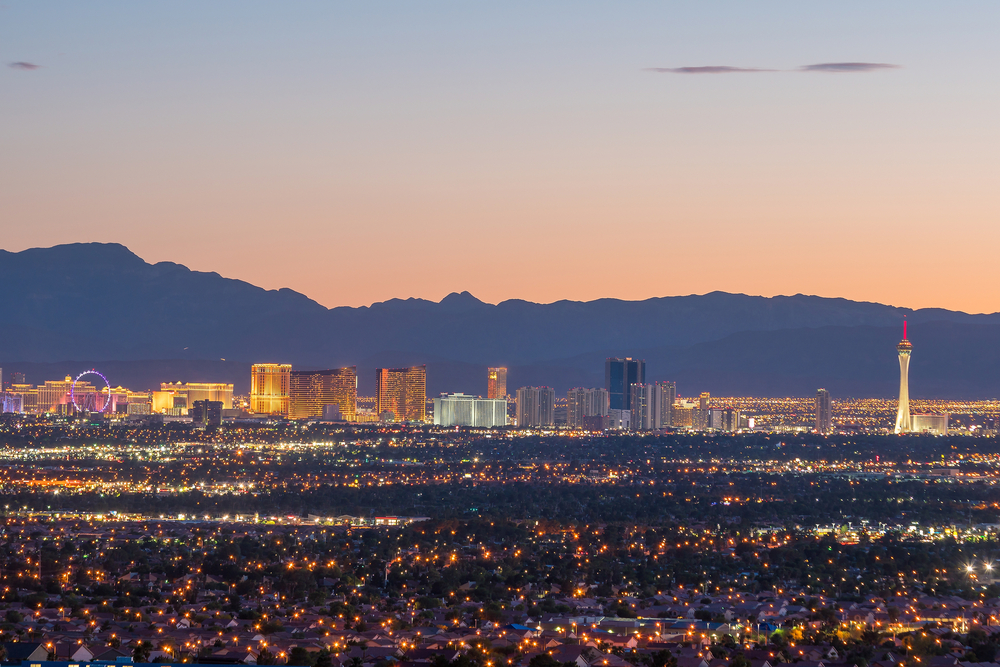
Photo Credit: f11photo / Shutterstock
2. Las Vegas-Henderson-Paradise, NV
- Average annual unemployment rate in 2021: 8.3%
- Average number of unemployed workers in 2021: 92,877
- Change in unemployment rate since 2020 (percentage points): -6.4
- Change in unemployment rate since 2019 (percentage points): +4.2

Photo Credit: Eric Urquhart / Shutterstock
1. Los Angeles-Long Beach-Anaheim, CA
- Average annual unemployment rate in 2021: 8.7%
- Average number of unemployed workers in 2021: 576,693
- Change in unemployment rate since 2020 (percentage points): -3.1
- Change in unemployment rate since 2019 (percentage points): +4.5
Detailed Findings & Methodology
To determine the locations with the highest overall unemployment rate in 2021, researchers at Filterbuy analyzed the data from the U.S. Bureau of Labor Statistics’s Local Area Unemployment Statistics. The researchers ranked locations according to the average annual unemployment rate in 2021. In the event of a tie, the location with the larger average number of unemployed workers in 2021 was ranked higher. Researchers also calculated the change in unemployment rate since 2020, and the change in unemployment rate since 2019. To improve relevance, only metropolitan areas with at least 100,000 residents were included. Additionally, metros were grouped into cohorts by population: small (100,000–349,999), midsize (350,000–999,999), and large (1,000,000+).